Venture Studio
Venture Studio
A Comparative Analysis of Private
Company Ownership Models
Private Equity, Venture Capital & Venture Builders


By Jonathan Schroeder, Director of Investments, InVitro Capital
Allocations to private markets have grown significantly over the past two decades, now representing 30–50% of many institutional and family office portfolios [1]. Within this, roughly half is dedicated to equity ownership in private companies—strategies that prioritize long-term capital appreciation through direct ownership and operational value creation [2].
This paper compares three such models: Private Equity, Venture Capital, and the emerging but fast-growing category of Venture Building. Each offers distinct advantages, tradeoffs, and structural implications around liquidity, control, and return visibility.
Rather than recommending a single approach, this report provides a comparative framework to help allocators determine how best to deploy capital across these equity strategies—balancing risk, duration, and governance alignment within the broader private allocation.
Allocators are rethinking how to structure exposure to private company ownership. As Private Equity (PE), Venture Capital (VC), and Venture Building (VB) evolve, each offers distinct advantages in return potential, capital pacing, and governance alignment. This paper provides a comparative framework to inform portfolio construction across these strategies.
Recommended Allocation (as a percentage of total portfolio capital):
Structural Takeaways:
In a cycle defined by rising dispersion and slower capital flows, allocator success depends not just on selecting strategies—but on how capital is structured, paced, and governed.
In the early 1990s, private markets were a marginal part of institutional and family office portfolios—typically making up less than 5–10% of total allocation. Public equities and fixed income dominated, while hedge funds and real estate served as the main alternative exposures.
By the early 2000s, private equity began to scale, supported by strong buyout performance, low interest rates, and growing institutional acceptance. Venture capital was more cyclical, peaking during the dot-com boom and reemerging in the late 2000s.
After the 2008 financial crisis, the shift accelerated:
Private markets have moved from niche to foundational in allocator portfolios. Today, they often account for 30–50% of total capital allocation—encompassing private credit, real estate, infrastructure, and company ownership strategies.
Within that, approximately 15–25% of total portfolios—or half of the average private markets allocation—is directed toward equity ownership in private companies. This includes traditional buyouts and growth equity, early-stage venture capital, and increasingly, structured models like venture building.
These strategies aim to generate outsized returns through direct ownership, operational leverage, and long-term value creation. But as competition increases and capital cycles lengthen, allocators are rethinking not just where to invest—but how [3].
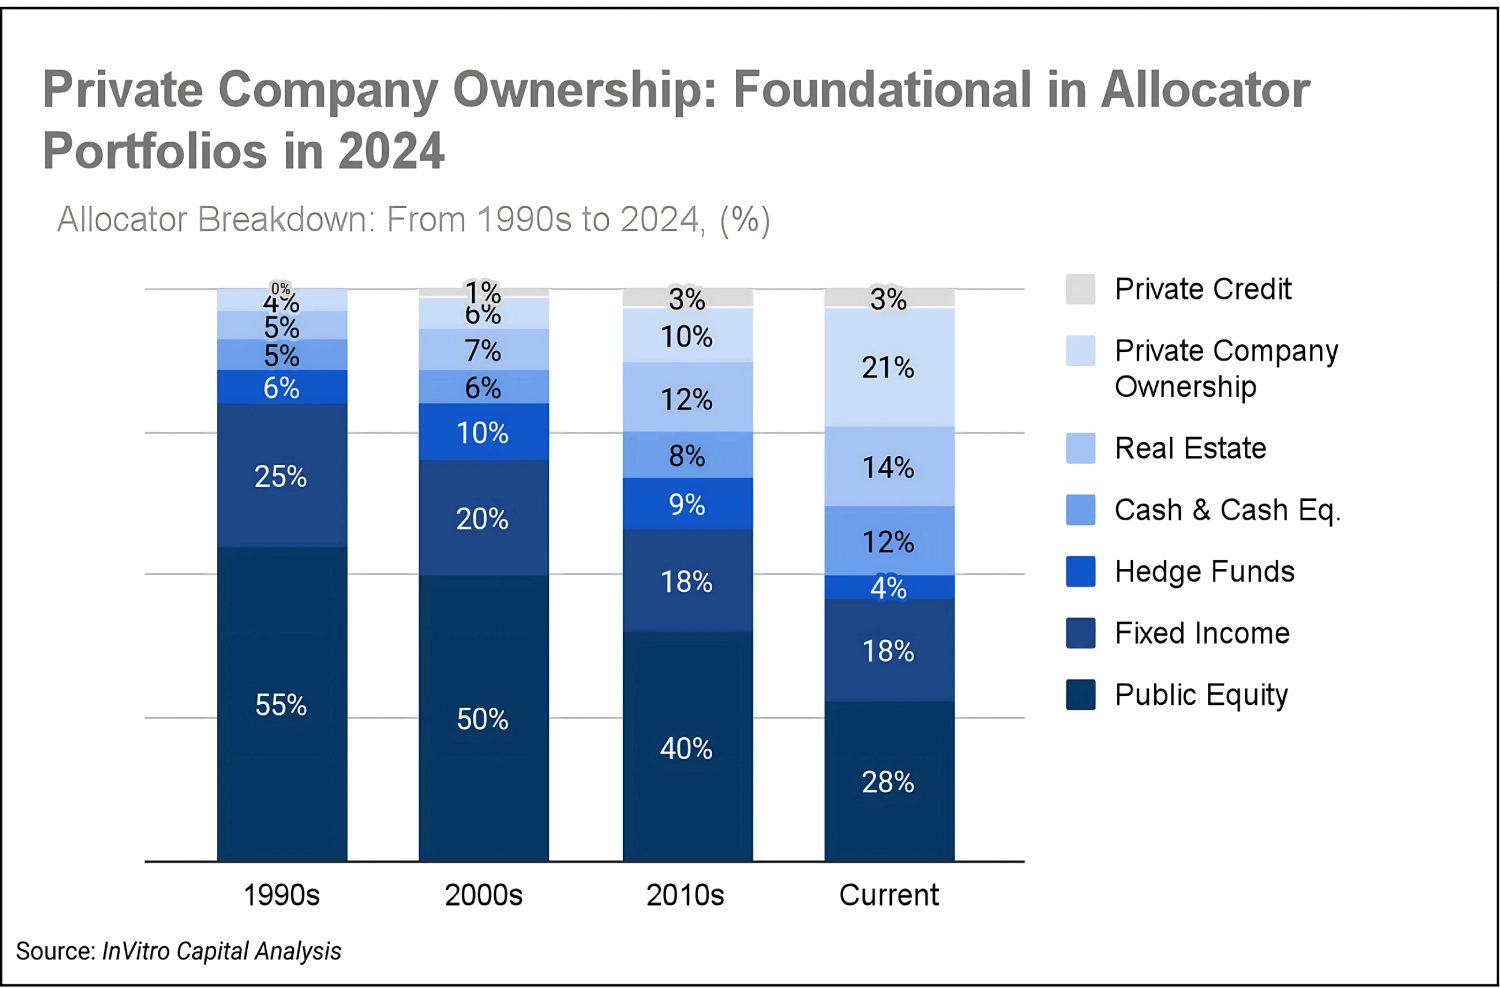
Note: Data synthesized from multiple family office allocator reports, 1990s–2024.
Allocations reflect harmonized averages, not sourced from a single dataset.
This paper focuses on three equity ownership models that represent the core of private company investing:
Each strategy is evaluated through an allocator lens across four key dimensions:
For allocators constructing portfolios with long-duration capital, varying liquidity needs, and a desire for aligned value creation, understanding the nuances of each model is critical to designing effective private company exposure.
Private Equity (PE) remains a central allocation in institutional and family office portfolios. It offers concentrated ownership, governance control, and access to scaled private businesses. But the nature of value creation in PE has evolved. Where leverage and multiple expansion once drove outperformance, today's returns depend increasingly on operational execution and margin growth.
Over the past decade, Private Equity has delivered consistent net returns, with a modest but growing degree of dispersion:
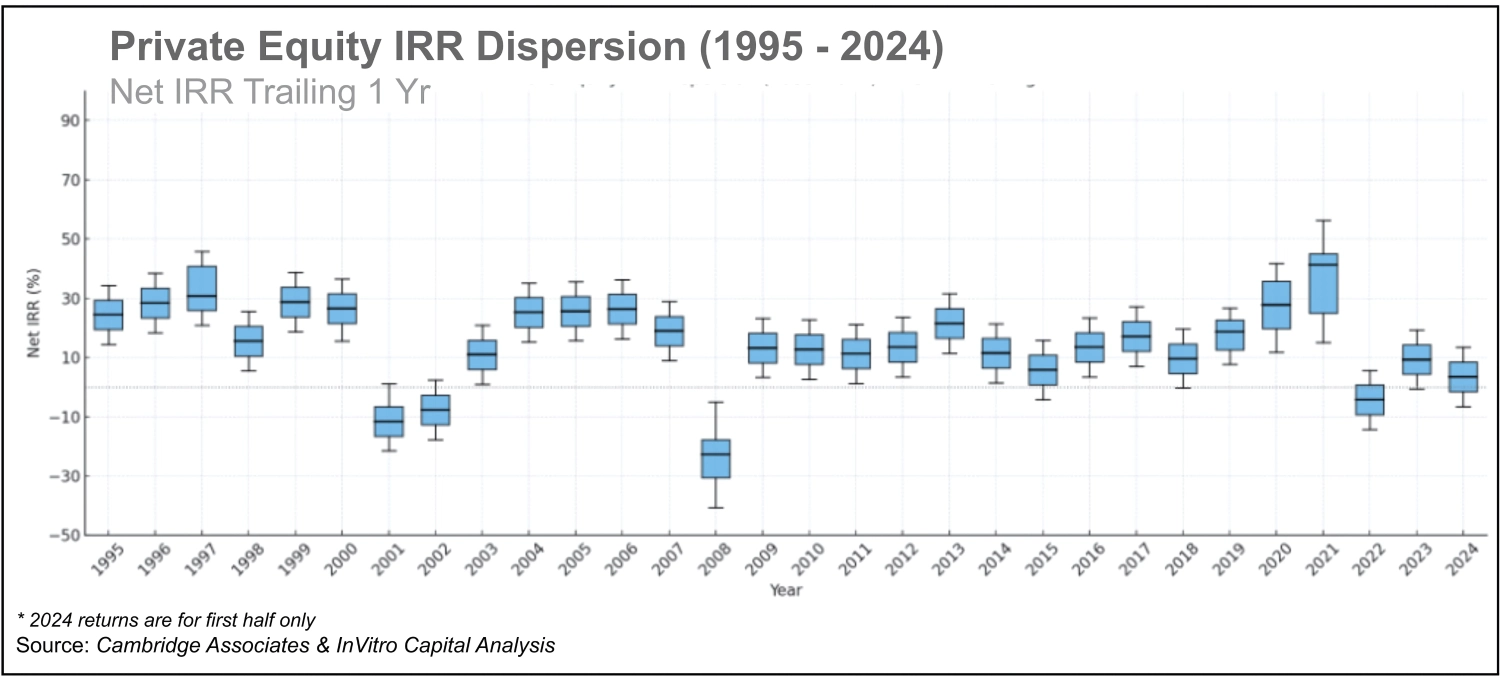
Note: Median data is sourced from the Cambridge Associates US Private Equity Index, which reflects actual one-year trailing Net IRR based on net asset value (NAV) and distribution data across institutional PE funds. Dispersion data (quartile and decile estimates) is synthesized from multiple industry sources, including family office allocator surveys and internal modeling. These estimates are illustrative and meant to capture directional variability, especially during periods of heightened market dislocation (e.g., 2000–2002, 2008–2009, 2021–2023).
This widening spread reflects increasing differentiation between operationally focused managers and those exposed to overpaying or under-executing. While the average return premium over public markets persists, it has begun to narrow.
At the same time, capital concentration is accelerating. Between 2022 and 2024, the number of active PE funds fell by more than 60%, even as fund sizes grew—signaling that LPs are consolidating commitments around proven operators.
Allocator lens: Private Equity remains a reliable long-term return engine—but outcomes vary significantly.
In today's environment, strategy, sector specialization, and manager execution matter more than vintage or scale.
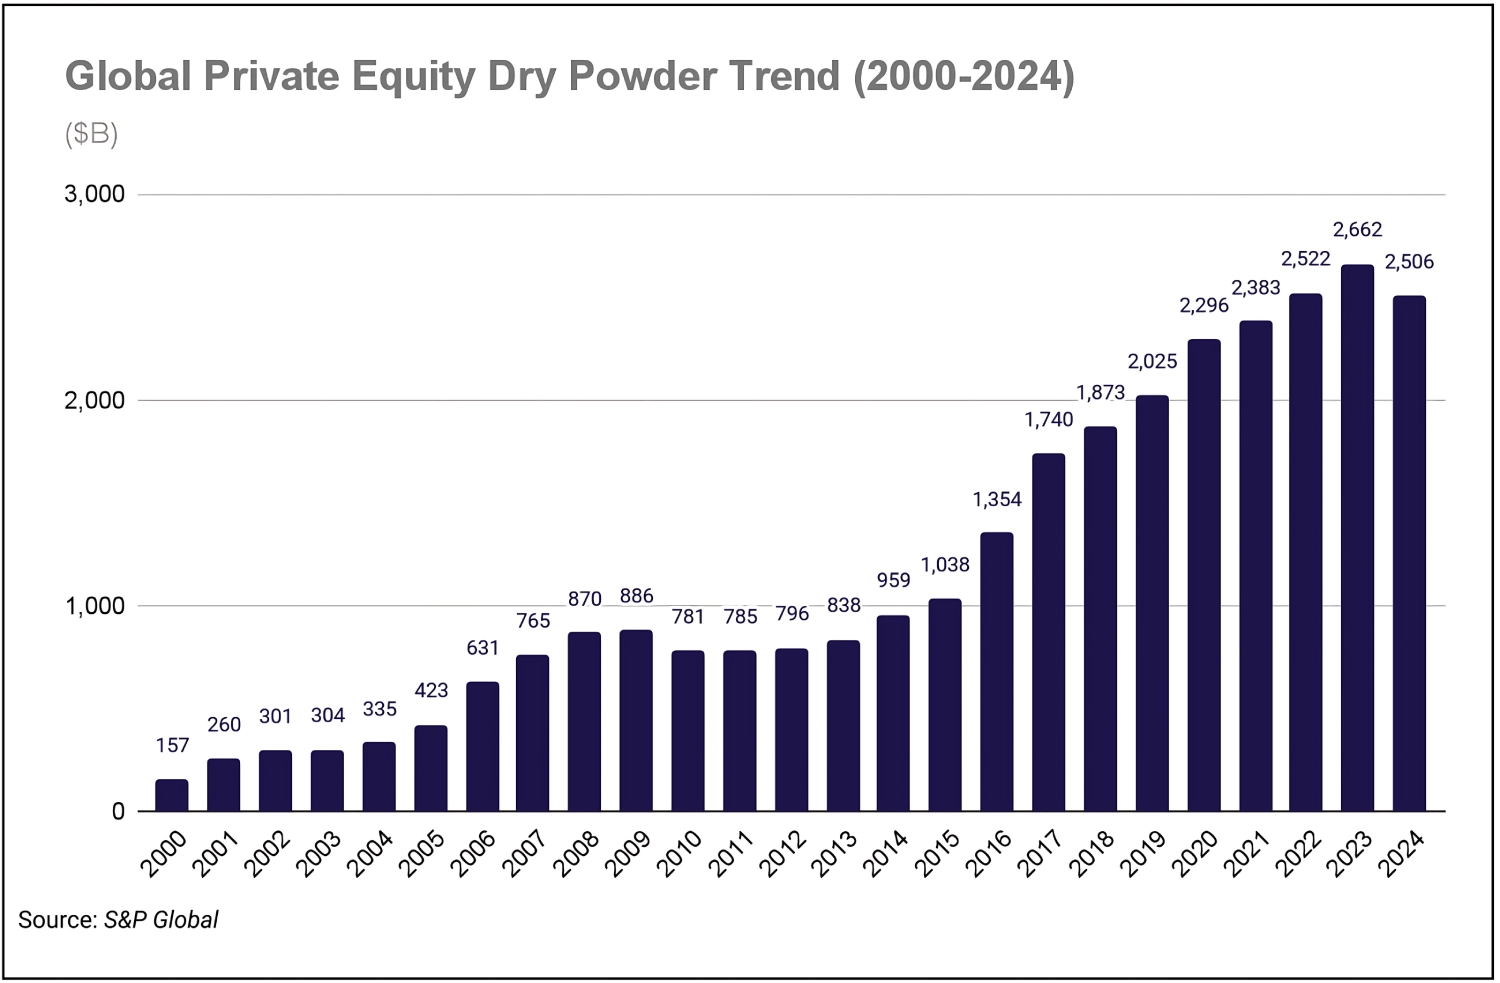
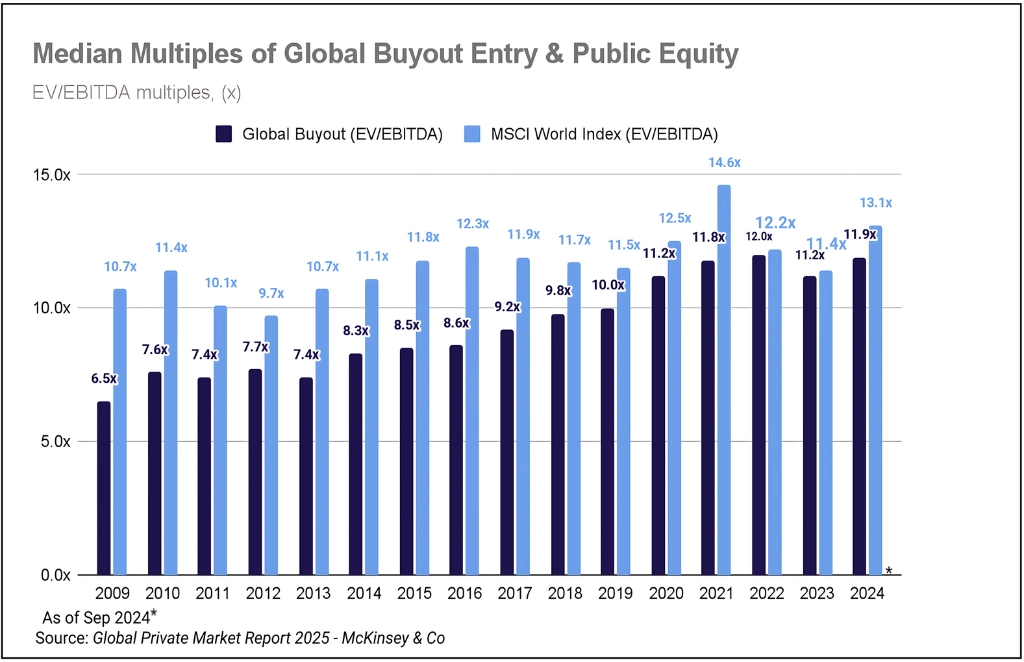
Over the past decade, private equity has experienced a significant influx of capital. Global dry powder has more than tripled—from ~$500B in 2010 to over $2.5T in 2024—driven by persistent allocator demand and strong historical returns. However, this capital surge has not been matched by a proportional increase in deal volume, intensifying competition for assets and inflating entry prices across the board.
At the same time, the valuation gap between private equity and public markets has steadily narrowed. In 2009, global buyout EV/EBITDA entry multiples were 4–5 turns lower than public market valuations. By 2024, that spread had compressed to just ~1.2x. While private equity once benefited from meaningful entry discounts or premium exits relative to public comparables, this arbitrage has largely disappeared—particularly in larger transactions.
As a result, multiple expansion is no longer a dependable driver of returns. With entry and exit multiples converging, private equity value creation must increasingly rely on fundamental EBITDA growth, operational improvements, and strategic M&A.
Moreover, the abundance of capital is pushing more firms down market. Sponsors are increasingly pursuing smaller platform investments with a greater reliance on add-on acquisitions, driving up deal activity and likely inflating multiples in the lower middle market as well.
Note: This analysis is based on global data, as consistent U.S.-only data is more limited. However, the directional trends—compression of private/public valuation spreads and increasing dry powder—are broadly consistent across geographies, including the U.S.
Allocator Lens: Entry discipline and operational execution are paramount moving forward. The next generation of outperformers will not be those who rely on favorable market beta or multiple re-rating at exit, but rather those who buy well, build real value, and grow earnings sustainably across cycles.
Historically, leverage was a defining tool in private equity—used to enhance equity returns through capital structure optimization. While it remains a key component of deal structuring, the contribution of debt to value creation has declined in relative importance.
Today's environment presents two challenges:
At the same time, many portfolio companies entered this cycle with elevated debt levels. As EBITDA growth slows and exit timelines extend, servicing that debt becomes more complex—particularly in cyclical sectors.
Allocator lens: Leverage is no longer a free tailwind. Instead of amplifying returns, it can amplify fragility. Allocators should scrutinize capital structures, debt service coverage, and exit readiness—especially in funds that leaned heavily on leverage and multiple expansion in prior cycles.
PE remains structurally illiquid. Exit volumes peaked in 2021 (U.S. PE exits exceeded $840B), but by 2024, they had dropped by more than 50% [6]. Holding periods have lengthened across the board, with fewer realizations and delayed distributions.
This environment has constrained capital recycling, particularly for LPs with fixed pacing models or liquidity windows. While exit markets may normalize over time, allocators should plan for extended duration exposure and delayed cash returns.
Allocator lens: Vintage diversification and flexible pacing are essential to mitigate reinvestment risk and avoid portfolio congestion.
As of 2024, global PE dry powder is estimated to exceed $1.3 trillion, with a growing portion concentrated among large-cap and mega funds. This backlog of uncalled capital poses several implications:
Allocator lens: Dry powder creates both optionality and risk. Scrutinize manager discipline, underwriting standards, and pacing assumptions—especially in overfunded segments.
Private Equity still serves as a foundational portfolio building block—but the basis of value creation has shifted. Future outperformance will come from managers who can improve operating metrics, control costs, and exit selectively—not from those leaning on leverage-driven returns or multiple uplift.
Allocators should treat PE as a core, mid-risk exposure, best suited for:
Summary insight: PE isn't broken but the playbook has changed. Structure, execution, and pacing not access now determine outcomes.
Venture Capital (VC) offers a unique proposition in private portfolios: access to innovation, early ownership in high-growth companies, and exposure to long-tail upside. But alongside its potential for nonlinear returns comes a structural profile of illiquidity, volatility, and return dispersion. For allocators, venture requires selectivity, conviction, and sizing discipline.
VC continues to show the widest spread of outcomes in private markets:
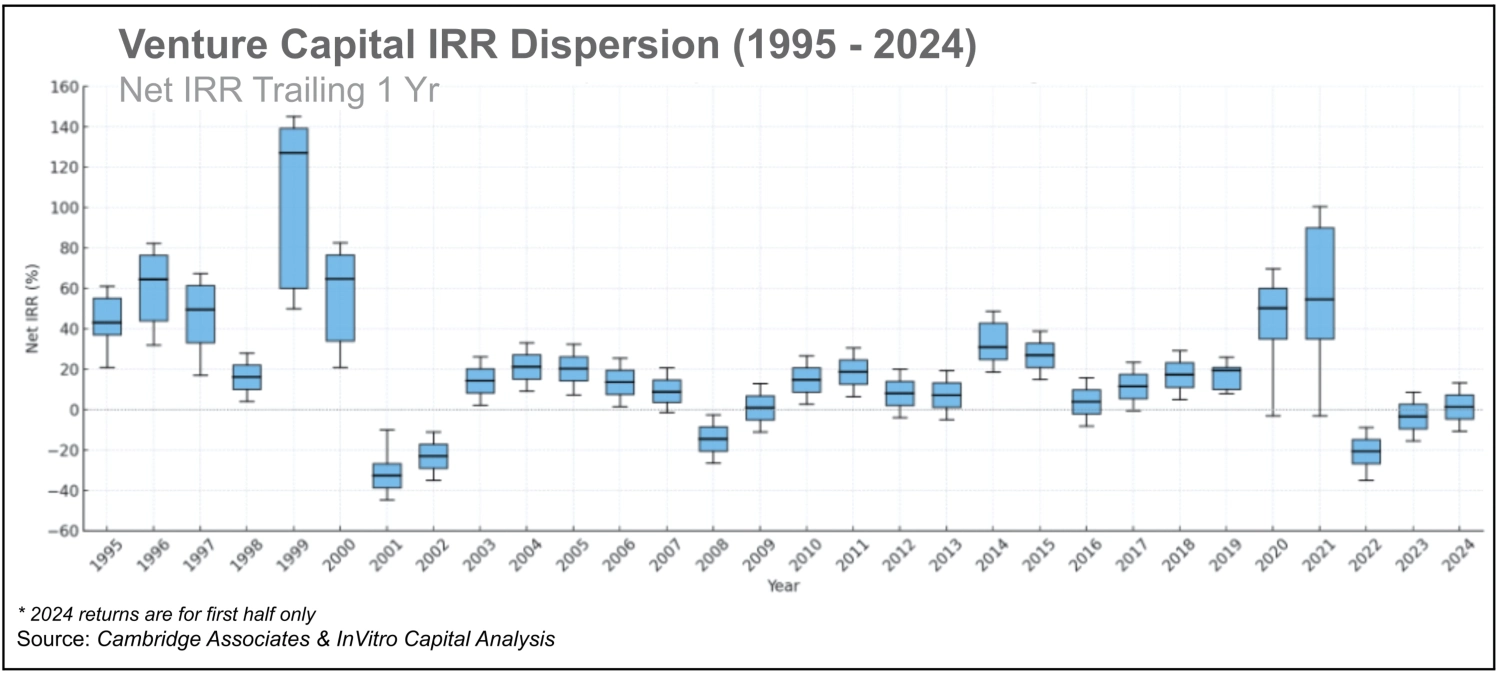
Note: Median data is sourced from the Cambridge Associates Venture Capital Index, which reflects actual one-year trailing Net IRR based on fund-level NAVs and distributions. Dispersion data (quartile and decile estimates) is synthesized from a range of industry references, including institutional benchmarks, family office reports, and modeled interpolation. These dispersion figures are illustrative, intended to reflect directional variance across market cycles — particularly during periods of excess and correction such as the Dot-Com Bubble (1999–2002), the Global Financial Crisis (2008–2009), and the post-2021 revaluation period.
This dispersion reflects stark differences between access tiers, manager quality, and deal selection. While VC retains potential to drive outlier returns, the average fund underperforms without strong portfolio concentration and exit discipline.
Meanwhile, valuation efficiency—returns per dollar invested—has eroded. Higher cost basis, slower realizations, and extended time-to-liquidity have compressed effective fund-level performance.
Allocator lens: VC exposure should be intentional and appropriately sized. It can shape portfolio upside but requires high tolerance for volatility and time risk.
Liquidity remains the central constraint in venture portfolios. Consider three reinforcing headwinds:
Much of this illiquidity stems not only from public market valuation resets, but from deeper structural inertia. Many companies are stuck—too mature for early-stage capital, too small or unprofitable for private equity, and too expensive relative to buyers' expectations.
GPs often delay hard resets like down rounds or recaps to avoid marking down NAV. Instead, these companies enter survival mode: conserving cash, cutting burn, and hoping sentiment returns.
The result: a growing layer of "zombie" assets—startups that don't fail but no longer grow or return capital.
Allocator lens: The risk isn't dramatic loss—it's stagnation. Without growth, exit, or reset, these companies erode IRRs over time. Allocators should underwrite not just potential—but pacing and resolution pathways.
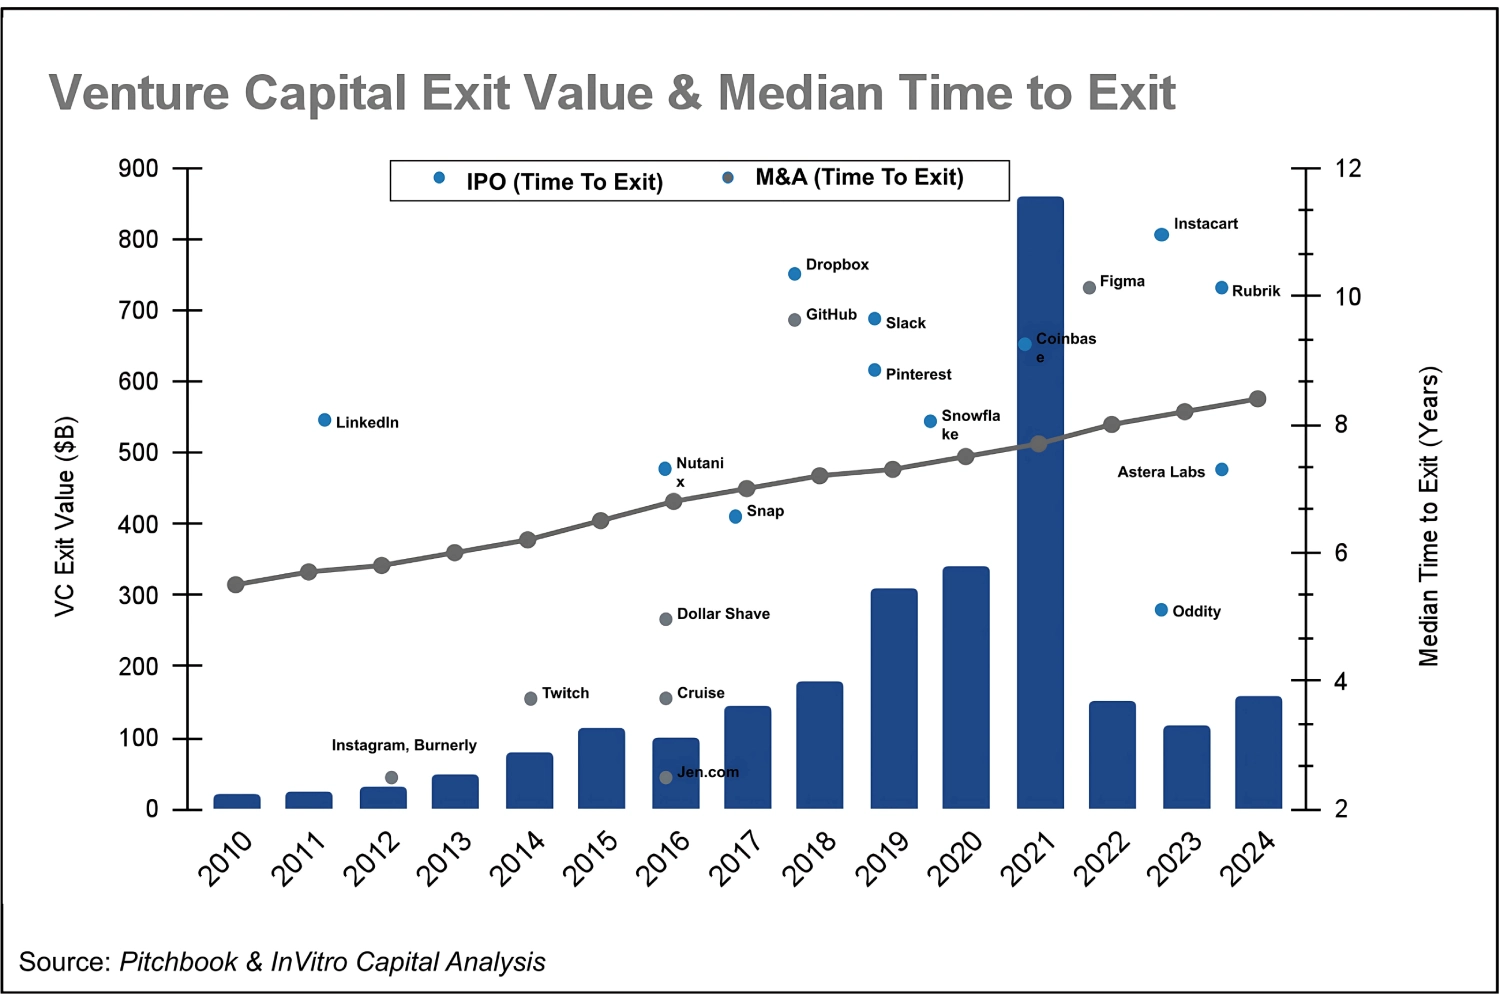
Note: VC exit value data (blue bars) reflects actual annual U.S. startup exit volume by dollar value, sourced from PitchBook. Company-specific exit examples (e.g., LinkedIn, Snowflake, Instacart) represent verified U.S.-based outcomes, confirmed through public filings and multiple data sources. The median time-to-exit trendline is modeled based on synthesized estimates from various U.S.-focused industry benchmarks and reports, intended to illustrate directional trends rather than precise durations.
Venture capital allocates into early-stage companies with inherently binary outcomes. Success depends on product-market fit, founder execution, and favorable market timing. But beyond traditional early-stage risk, allocators now face structural inefficiencies across the full portfolio lifecycle.
Key risk drivers include:
Valuation efficiency—measured as return per dollar invested—has dropped from 4.5x in 2021 to ~3.0x in 2025, a reflection of prolonged timelines and lower capital productivity.
Venture Capital is still a powerful access vehicle for innovation—but it must now be evaluated with a greater emphasis on liquidity realism and pacing discipline.
The bigger issue is no longer whether a company fails—it's whether it can exit at all. Many portfolio companies will linger without growth, impairing fund-level IRRs and distributions
Allocators should approach VC as a long-duration, high-conviction exposure, best suited for:
Summary Insight: Venture still creates generational winners—but right now, the structural risk isn't blowups—it's stagnation. Allocators must size, pace, and underwrite accordingly.
Venture Building—also known as the studio model—originates, funds, and launches startups internally. It emphasizes ownership control,milestone-based capital deployment, and structural alignment. For allocators, it provides a disciplined alternative to traditional VC with a differentiated risk–return profile.
While some traditional venture studios operate primarily as feeders into VC pipelines—and are thus best categorized under the broader VC umbrella—this analysis focuses on commercially-led Venture Builders that take a holdco-of-startups approach, owning and actively scaling a portfolio of companies with long-term operational involvement.
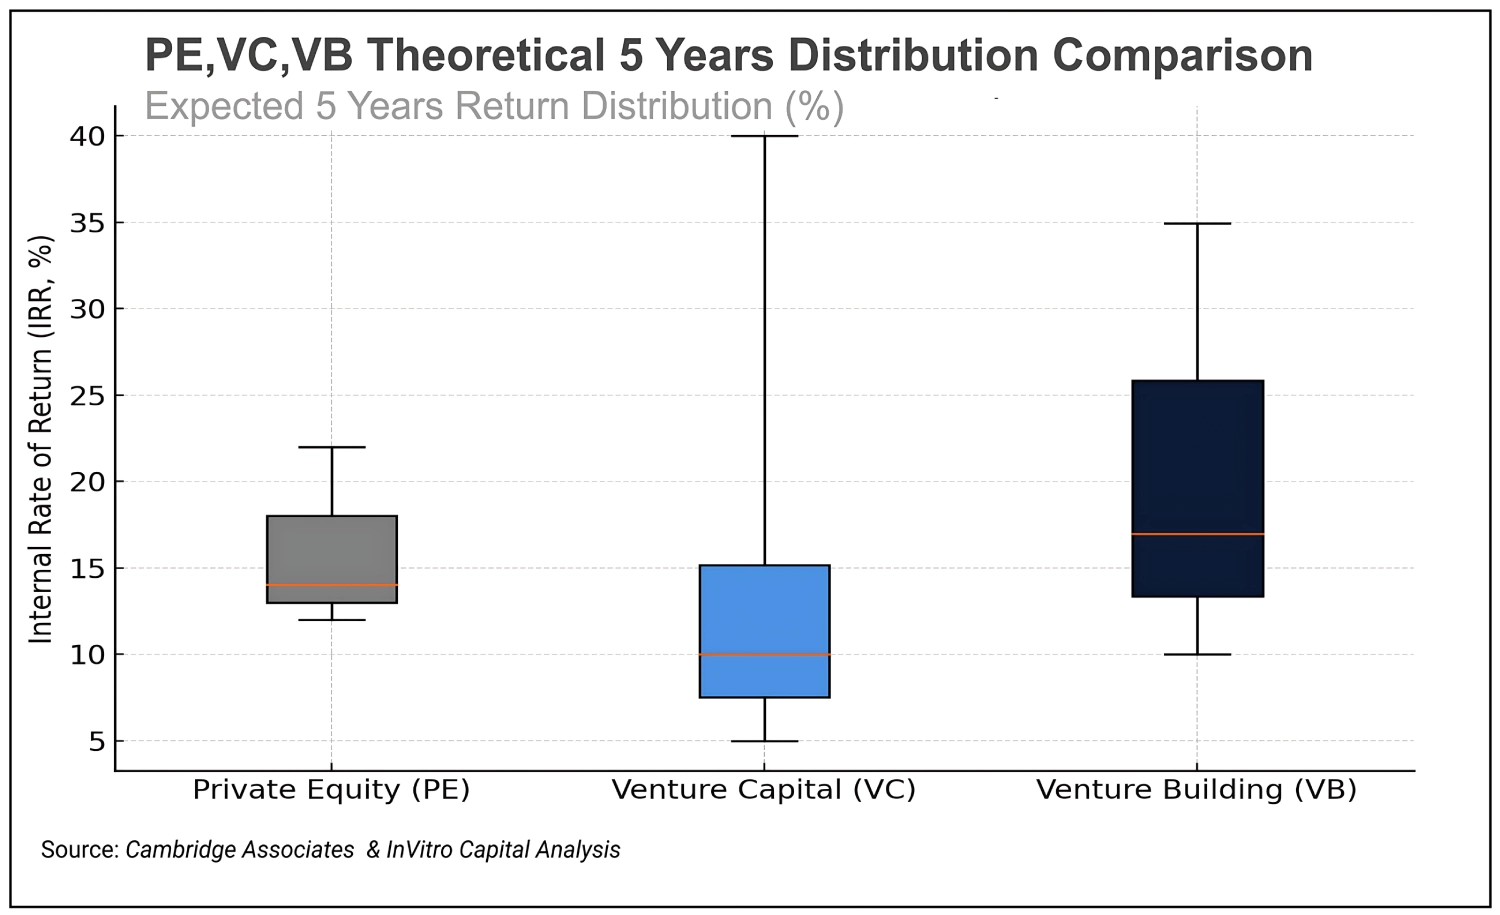
Note: IRR distributions for Private Equity, Venture Capital, and Venture Building are modeled based on historical data from the past decade and projected forward under normalized conditions. Private Equity is grounded in benchmarked trailing net IRRs (e.g., Cambridge Associates). Venture Capital reflects a wider distribution informed by vintage-level volatility and exit dynamics. Venture Building is constructed from historical studio outcomes and internal benchmarks.
Returns are driven by better capital efficiency, tighter screening, and fewer write-offs—but vary significantly by team and execution approach.
Traditional venture studios typically follow a long-cycle approach focused on ideation, team formation, and product development. These models often require 6–10+ years to reach meaningful liquidity, as they depend on later-stage venture funding and extended scaling periods.
In contrast, go-to-market-led studios prioritize early commercial validation, customer acquisition, and operational readiness. These studios are designed to produce earlier outcomes, with typical exit timelines of 3–5 years in well-executed cases [12].
Venture building reduces some early-stage risks such as founder mismatch or inefficient capital spend but introduces others:
Diversification concerns, while often cited, are overstated. The risk-adjusted benefit of portfolio size is nonlinear:
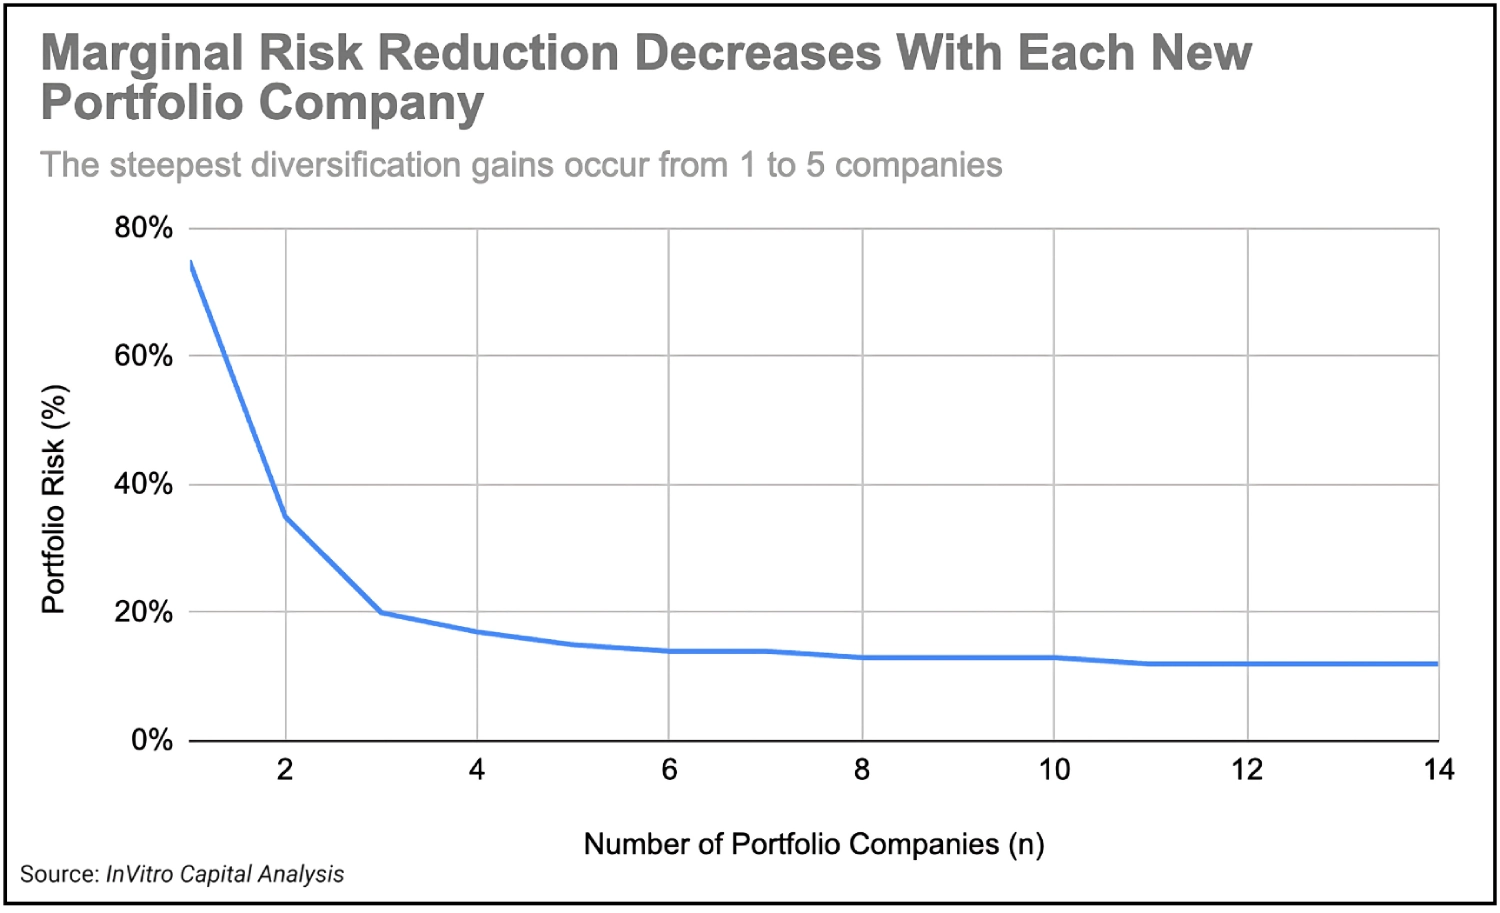
Note: Chart illustrates the theoretical reduction in unsystematic portfolio risk as the number of portfolio companies increases, based on classical portfolio theory. Risk reduction is modeled assuming equally weighted assets with no correlation across company-specific returns.
This reinforces the importance of concentrated quality over shallow breadth—especially in studio models where shared infrastructure is a core advantage.
Allocator lens: Venture building is not about volume—it's about precision. Studios with clear focus and disciplined build criteria tend to outperform scattered, opportunistic models.
A growing constraint across private markets is the limited supply of acquisition-ready, well-priced companies. As capital has outpaced deal flow, both PE and later-stage VC funds face deployment delays, inflated entry valuations, and longer exit timelines—each of which contributes to IRR decay and capital drag for allocators.
Venture building offers a potential release valve. By creating companies in-house—with clean cap tables, controlled burn, and acquirer alignment—studios can generate the kind of opportunities that traditional funds increasingly struggle to source.
For allocators, this can support returns in three ways:
These benefits aren't universal—but when venture building is executed well, it can serve as a complement that reinforces the overall performance of a private market allocation, especially in supply-constrained environments.
Venture building is increasingly used to create the very supply PE firms are seeking. In a market with constrained deal flow, studios offer allocators an upstream, controlled, and aligned entry point into innovation.
Still, this is a team-driven strategy. Outcomes hinge on operating quality, not structure alone.
Venture building complements VC and PE—not replaces them—and works best for allocators who can underwrite execution and want more control over capital and outcomes.
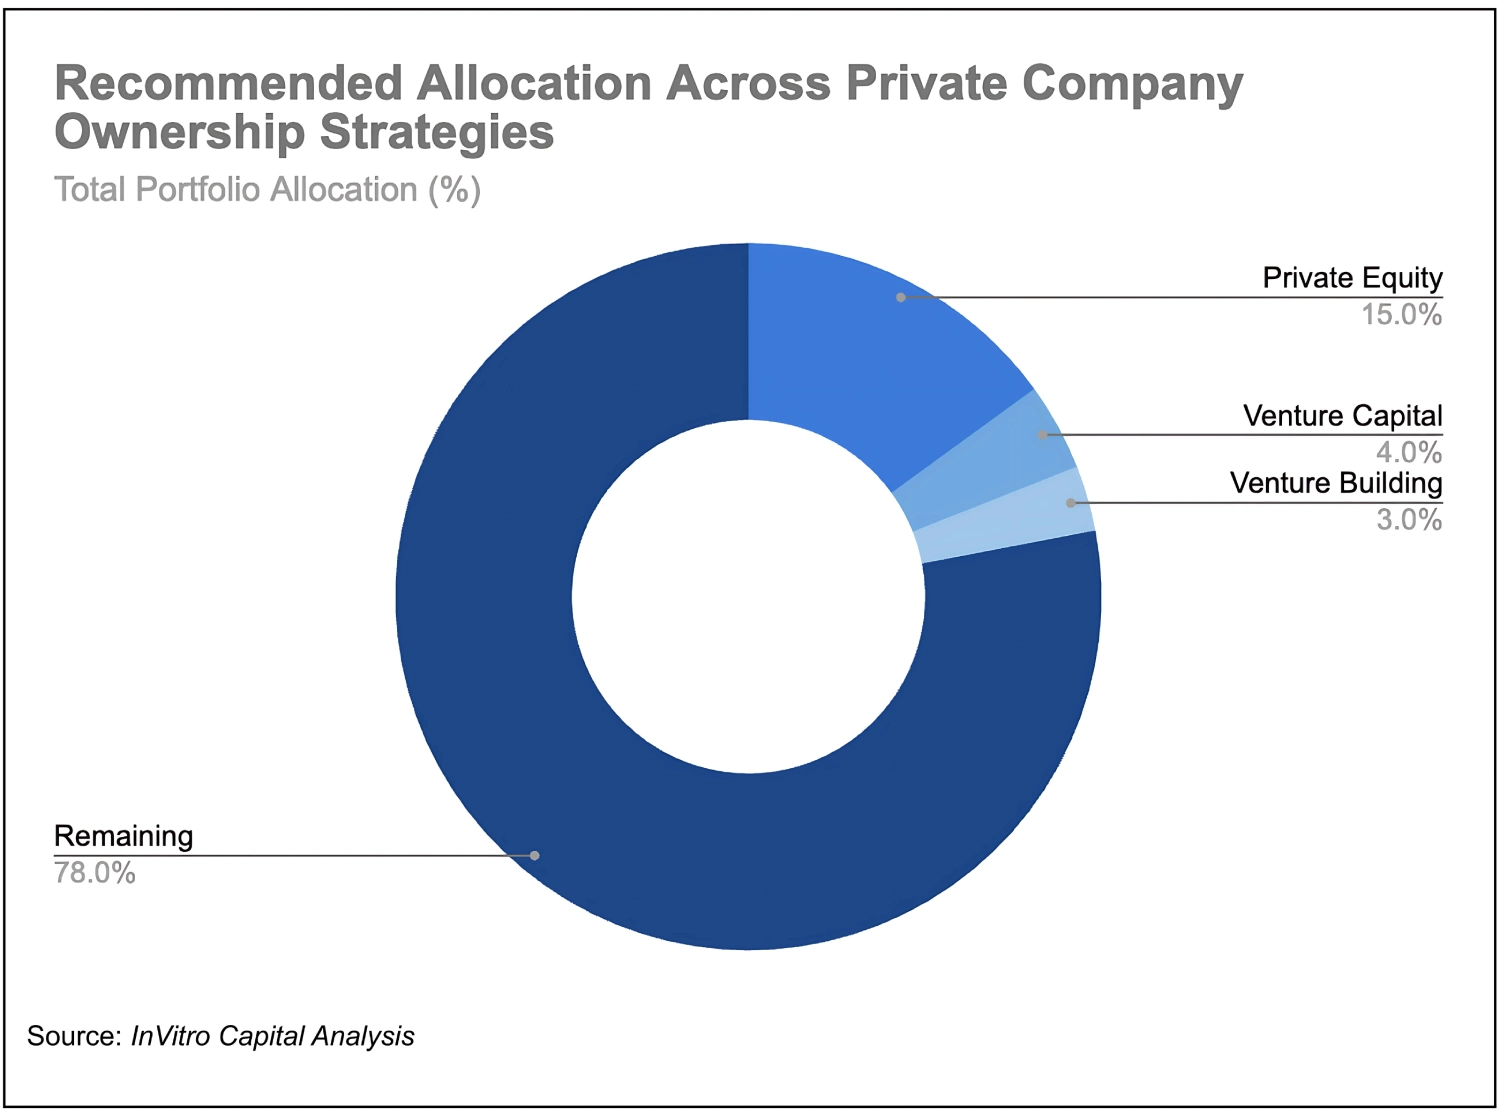
For allocators seeking long-term growth, governance alignment, and varied pacing across private markets, the following model allocation offers a balanced framework. These ranges are expressed as a percentage of the total portfolio, not just the private markets sleeve.
Disclaimer: This illustration is for informational purposes only and does not constitute investment advice or a recommendation. Allocations reflect generalized strategy-level views and may not be suitable for all investors. Please consult a registered investment advisor before making allocation decisions.
Each private market strategy—Private Equity, Venture Capital, and Venture Building—plays a distinct role in the allocator toolkit. Their effectiveness depends not just on return potential, but on pacing, operational bandwidth, and alignment with the allocator's edge. Below, we outline how each contributes to portfolio construction, along with recommended sizing for a $100 million portfolio.
Private Equity (12–16%): PE serves as the core private allocation for most long-term portfolios. It absorbs larger capital commitments and offers scaled exposure to cash-flowing businesses with structured exit paths. With lower dispersion than venture, it's suited for allocators seeking steady compounding with moderate illiquidity. Key success factors include pacing vintage exposure, avoiding fee drag from overcommitment, and leveraging co-investments where possible.
Venture Capital (incl. direct tech) (3–5%): VC provides access to innovation and asymmetric return potential, but its high dispersion and long duration demand disciplined sizing. A 3–5% allocation captures upside without overexposure to a single vintage or theme. Direct early-stage tech positions—if they share similar illiquidity and risk profiles—should be counted within this sleeve. VC works best when the allocator has thematic conviction, access to top-tier funds, or internal sourcing capability. Avoid over allocating based on trend alone.
Venture Building (2–4%): As a targeted complement, venture building enables upstream ownership with greater control over capital deployment. A 2–4% allocation allows allocators to benefit from tighter alignment, milestone-based pacing, and internal validation—while containing the operational burden. It is especially effective for those with domain expertise or direct involvement in the build process. Since scalability is limited, quality of execution and selectivity are more important than breadth.
In private markets, capital is deployed and returned over long, uneven timelines. Effective allocators must layer illiquidity risk across strategies to maintain flexibility, manage capital calls, and smooth return profiles. The three strategies discussed—Private Equity, Venture Capital, and Venture Building—each contribute differently to the portfolio's liquidity curve.
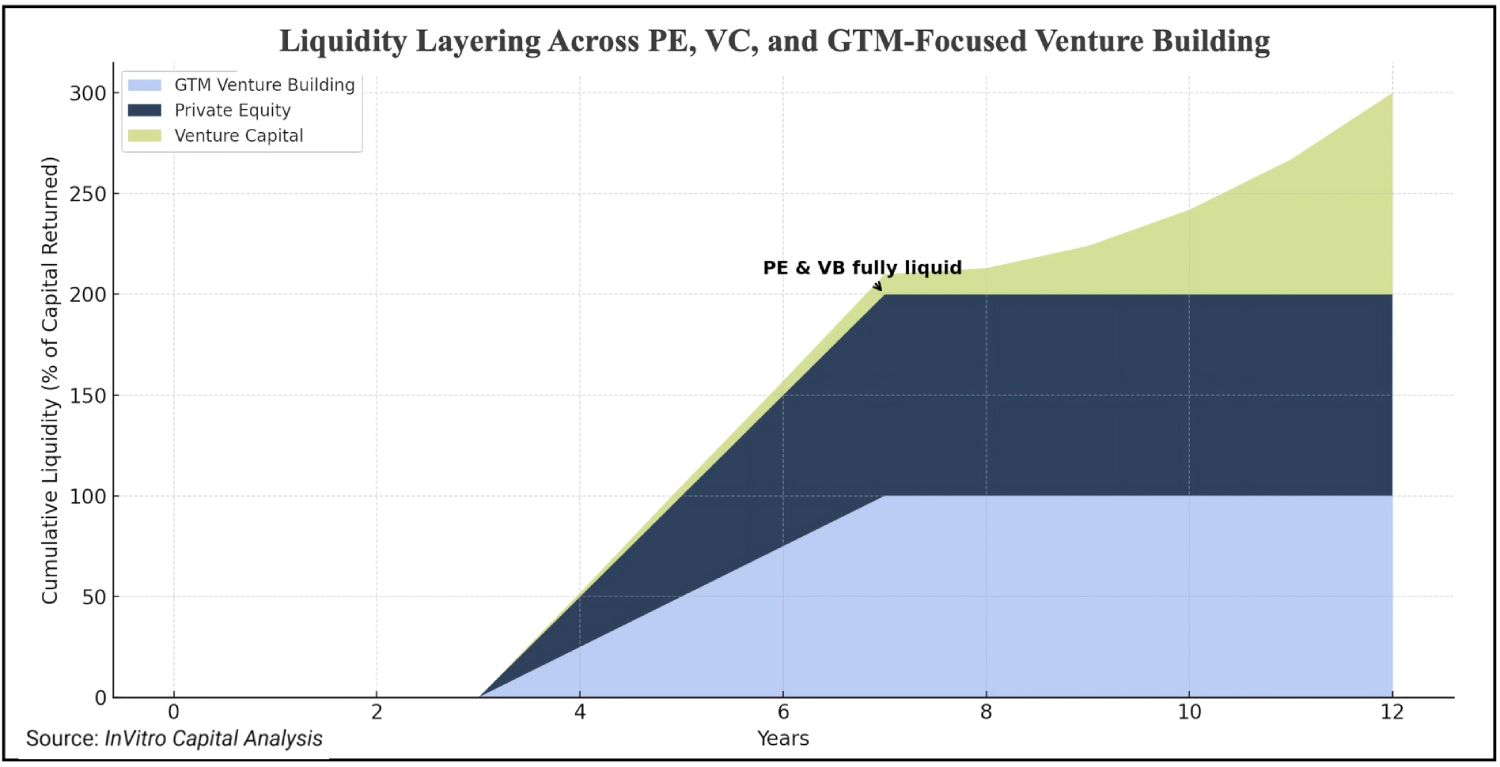
Note: Chart illustrates the timing of capital returned across GTM Venture Building, Private Equity, and Venture Capital strategies. Both Venture Building and PE reach full liquidity by years 7–8, while VC distributions extend through year 12. This chart reflects liquidity profile only and does not capture differences in total return or IRR.
Private Equity (12–16%): PE has relatively predictable pacing and exit windows. Funds typically draw down capital over 3–5 years and return it over 7–10. Allocators should stagger commitments across multiple vintages to avoid concentration risk and dry powder build-up. Co-investments can accelerate deployment and reduce fees but must be matched with internal underwriting capacity.
Venture Capital (3–5%): VC is less predictable and more back-weighted in its return timeline. Liquidity may take 10–14 years, with most returns concentrated in a few outsized exits. As a result, VC should be carefully sized and paced more slowly unless the allocator has high conviction in the manager or sector. Direct investments can create even longer hold periods and should be stress-tested against liquidity needs.
Venture Building (2–4%): Go-to-market-led venture building follows a milestone-based deployment model, enabling tighter pacing and the ability to pause or delay commitments based on company progress. While neither venture studios nor private equity typically provide liquidity before year three, GTM-led studios may generate earlier outcomes—particularly when aligned with strategic buyers from the outset. Although exits are execution-dependent and the model is generally less scalable than traditional fund strategies, venture building offers greater intra-sleeve liquidity control and can complement pacing strategies within a broader private portfolio.
Looking ahead, allocator preferences are likely to continue shifting toward models that offer greater control, capital efficiency, and earlier time-to-value. While private equity remains foundational, the bar for fund commitment is rising—driven by concerns around pacing, dry powder, and fee drag. Allocators are seeking tighter underwriting, more hybrid structures, and differentiated access to avoid overexposure to blind-pool strategies.
Venture capital will remain relevant for thematic upside, particularly in AI, biotech, and climate. But with persistent illiquidity and concentrated outcomes, VC allocations are already being trimmed or restructured. Many allocators are consolidating manager relationships or reallocating to crossover, thematic, or venture debt vehicles that offer better alignment and return visibility.
Venture building, though still early-stage in allocator portfolios, may grow gradually—from below 1% today to 2–5% over the next decade in select family offices or operating allocators. The model's appeal lies in capital control, milestone pacing, and upstream access. However, it requires infrastructure, focus, and execution visibility. For most allocators, VB will remain a niche satellite strategy. For those with a builder mindset or domain edge, it may evolve into a core part of their innovation exposure.
Sizing Outlook Over Time
Private equity, venture capital, and venture building each serve a distinct purpose in allocator portfolios—but none can be treated as plug-and-play. The days of passive blind-pool exposure are fading; what matters now is structure: how capital is deployed, governed, and returned.
Private equity remains a reliable engine for long-term compound growth, but its edge will increasingly depend on operational execution, disciplined pacing, and differentiated access. Venture capital still offers access to breakthrough innovation, but its return profile is becoming more fragile—requiring tighter sizing, higher selectivity, and liquidity-aware underwriting.
Venture building introduces a new paradigm: upstream ownership with tighter control and capital efficiency. While its role will remain constrained by scale and execution demands, it offers allocators a tool to shape early-stage outcomes more directly—particularly when used surgically within a broader portfolio.
The allocator's challenge is no longer just choosing the right asset class—but designing the right mix of exposure, pacing, and governance. With dispersion rising and capital cycles lengthening, thoughtful structure is the new source of outperformance.
The author acknowledges Amir Barsoum, Melinda Joseph, Mina Raafat, and Yara Daoud for their helpful comments and assistance during the preparation of this report.
For inquiries, detailed materials, or follow-up discussions, please contact:
Jonathan Schroeder
Director of Investments
InVitro Capital
1. UBS. Global Family Office Report 2023. UBS AG, 2023.
2. Citi Private Bank. Global Family Office Survey 2024. Citigroup Inc., 2024.
3. McKinsey & Company. Private Markets Annual Review 2024. McKinsey & Company, 2024.
4. Cambridge Associates. Private Equity and Venture Capital Benchmark Report 2024. Cambridge Associates LLC, 2024.
5. Bain & Company. Global Private Equity Report 2024. Bain & Company, 2024.
6. PitchBook. 2024 Private Equity Annual Report. PitchBook Data, Inc., 2024.
7. PitchBook and NVCA. Venture Monitor Q4 2024. PitchBook Data, Inc. and National Venture Capital Association, 2024.
8. Hamilton Lane. Market Overview 2024. Hamilton Lane Advisors, L.L.C., 2024.
9. Preqin. Venture Capital Exit Analysis 2023–2024. Preqin Ltd., 2024.
10. ILPA. ILPA Principles 3.0: Fostering Transparency, Governance and Alignment of Interests for General and Limited Partners. ILPA, 2023.
11. Morrow Ventures. Venture Studio Benchmarking Report 2023. Morrow, 2023.
12. Andreessen Horowitz. "The Studio Model: Innovation at Scale." a16z.com, 2022.